In our previous post, we covered some analysis on airport punctuality and how it was converging to its previous quarter and years trends. We covered data up until June 2024 (Q2 2024). CAA recently published the Sept and Oct 2024 data and the trend was broken with Q3 2024 being one of the most challenging for UK airports as a whole.
On-Time Performance (OTP) gives a measure of how punctual a flight is with 15 minutes of its scheduled arrival or departure time but it doesn’t tell you how late the flight is as its a binary measure.
In this post, we dive into the delay categories and try to unpack what is still holding airlines, airports, ground handlers and air traffic control colleagues from hitting their top line OTP targets. Aptly, we will call this analysis, nOTP (Not On-Time Performance).
Note: We inadvertently created a watermelon chart.
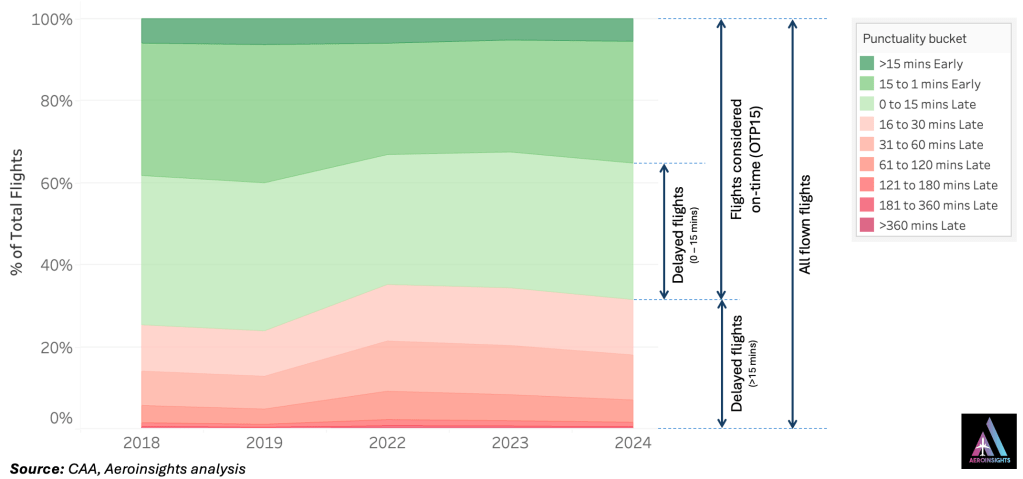
What we can see from this is chart is not only the OTP performance but also what delay categories are holding OTP back.
All UK airport delay performance
Analysis: All delays over 15 minutes are still higher than 2019 with a noticeable surge in summer as flight numbers ramp back up to 2019 levels.
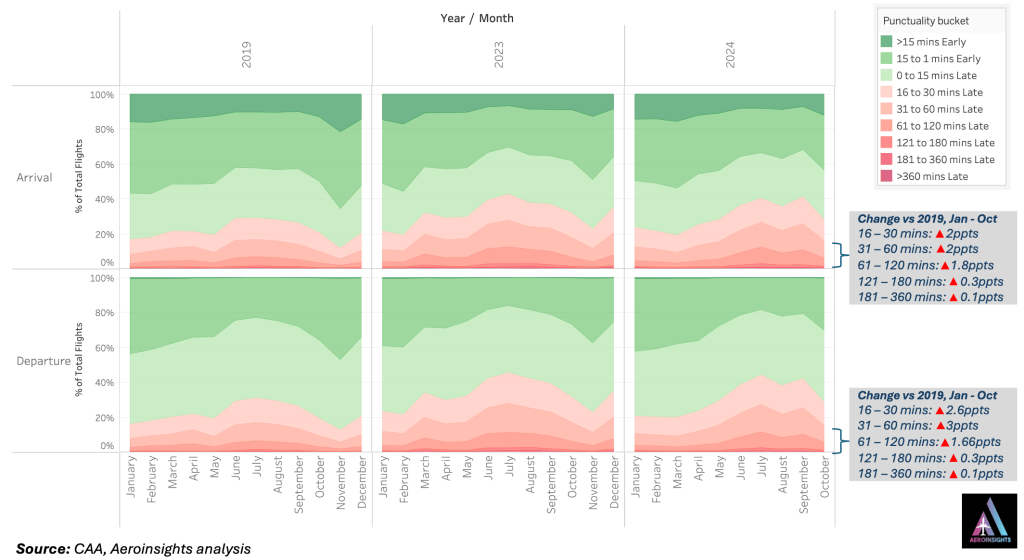
Alternative view:
Analysis: we can see the increases in each of these categories in the alternative view and particularly where months of June – September still show vulverability in arrival performance deteroriating vs 2019 and can be seen translating to departure delays.
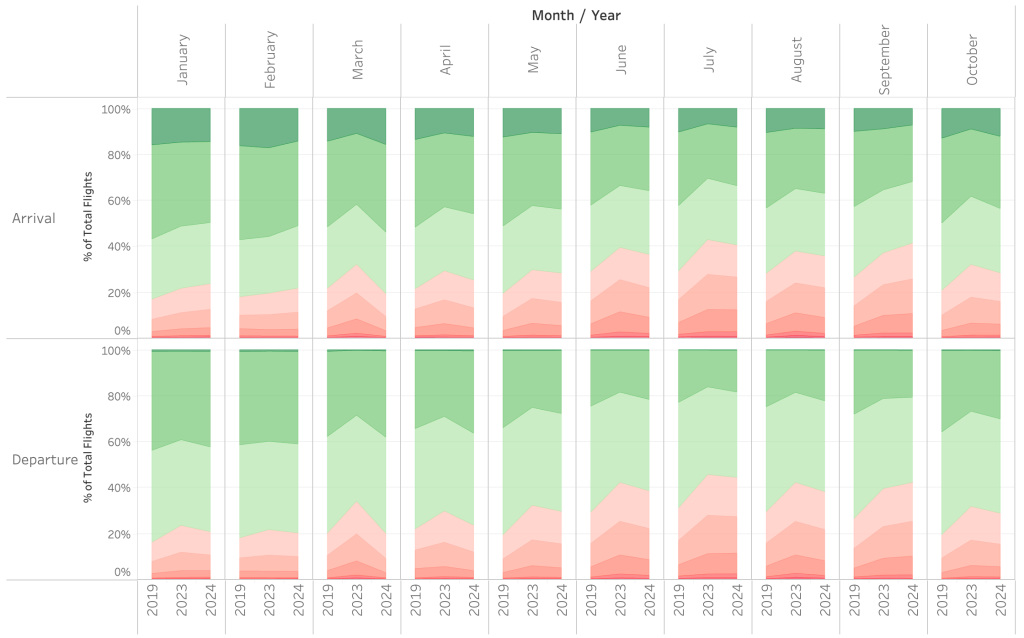
Airport analysis: Gatwick Airport

nOTP Analysis: Arrival delays between 31 and 120 mins are higher in 2024 YTD than they were in the same period in 2019. It is important to note that these delays are concentrated in the summer period. Departures see an increase of approx 1ppt over the arrival delay implying the turnarounds or taxiing could do with further analysis or optimisation.
Note that Gatwick’s target for OTP15 is 70% for summer (Apr – Oct) and 75% in winter (Nov – Mar), quite a gap from its current performance.
Percentage difference in number of flights delayed
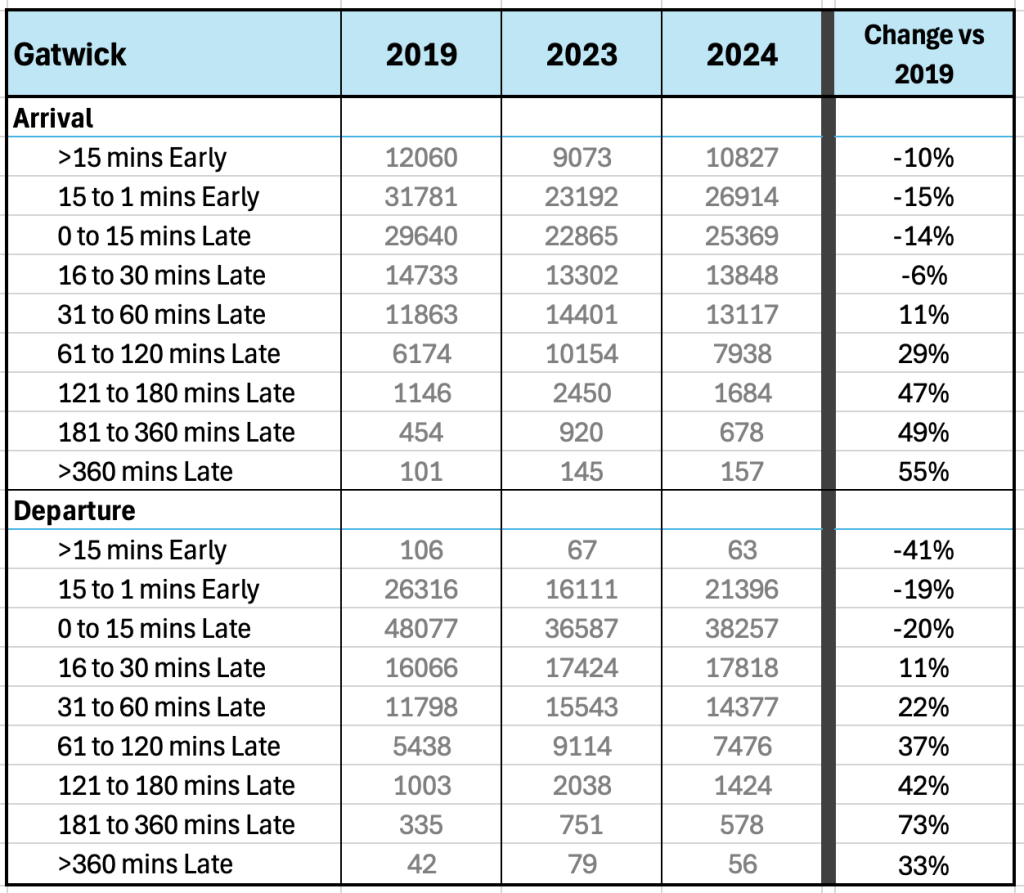
Percentage change from 2019: Looking at the percentage change, 121 – 180 min and 181 – 360 min delays for arrivals and departures have >40% increase in number of aircraft. These delays then stray into the UK261/EC261 (often referred to as EU261) category depending on the cause of the delay and whether it was in the airlines control or not.
Note that the airlines operating at these airports pick up the final liability of EU261 to passengers on the delays, not the airports or any other stakeholder in the ecosystem.
Airport analysis: Heathrow Airport
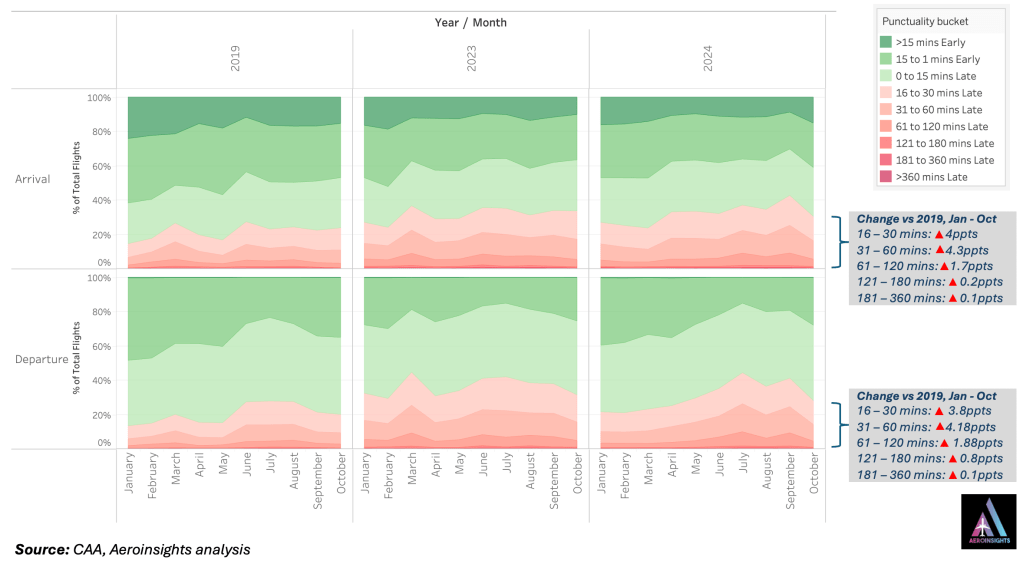
nOTP Analysis: delay increase in summer is not as pronounced as Gatwick (single runway) and >30 min arrival delays are still translating to departure delays with some increase between arrival and departure delays. This can be seen in the previous post too where we saw A15 and D15 switching in 2024 implying turnaround processes are getting better but there is still room for improvement in optimising these.
Percentage difference in number of flights delayed
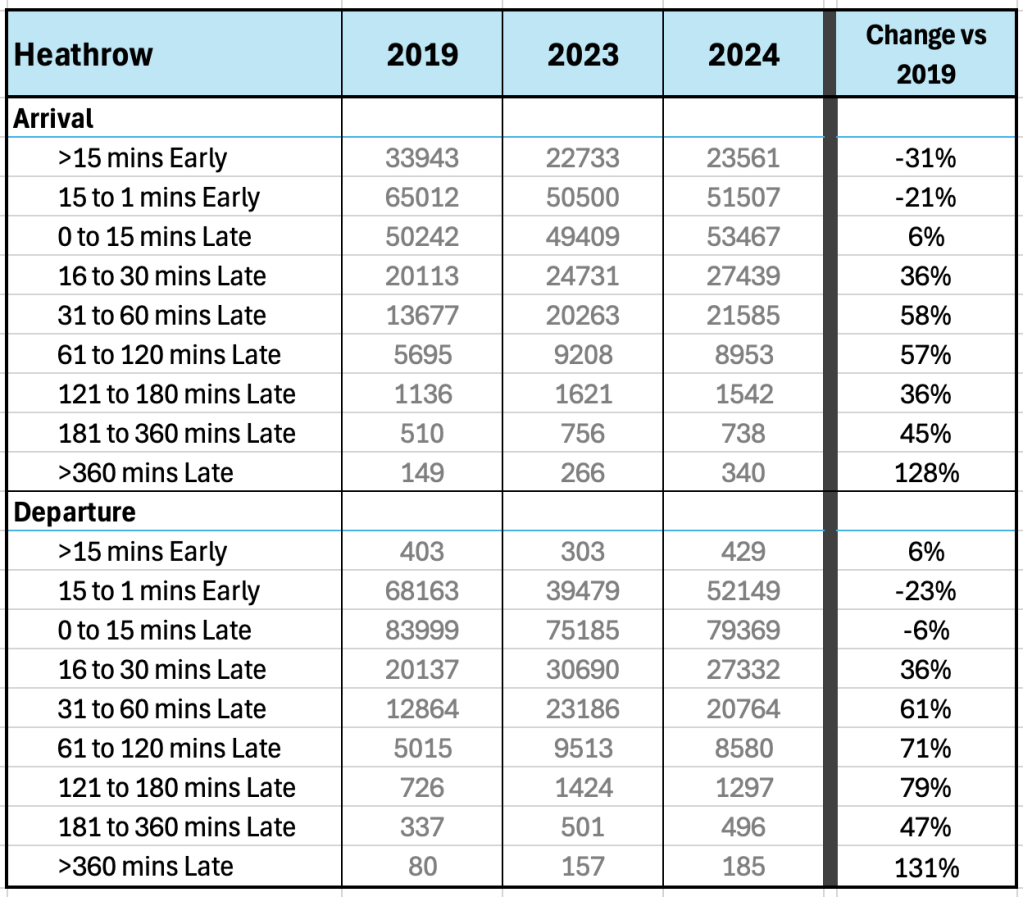
Percentage change from 2019: Slightly different story at Heathrow again, looking at the percentage change, 31 – 60 min and 61 – 120 min delays for arrivals and departures have >50% increase in number of aircraft. Delays in the UK/EC/EU261 categories have also seen increases in arrival and departure delays.
Note that departure delays from Heathrow may be recovered enroute to the destination (or indeed worsened enroute).
Airport analysis: Manchester Airport
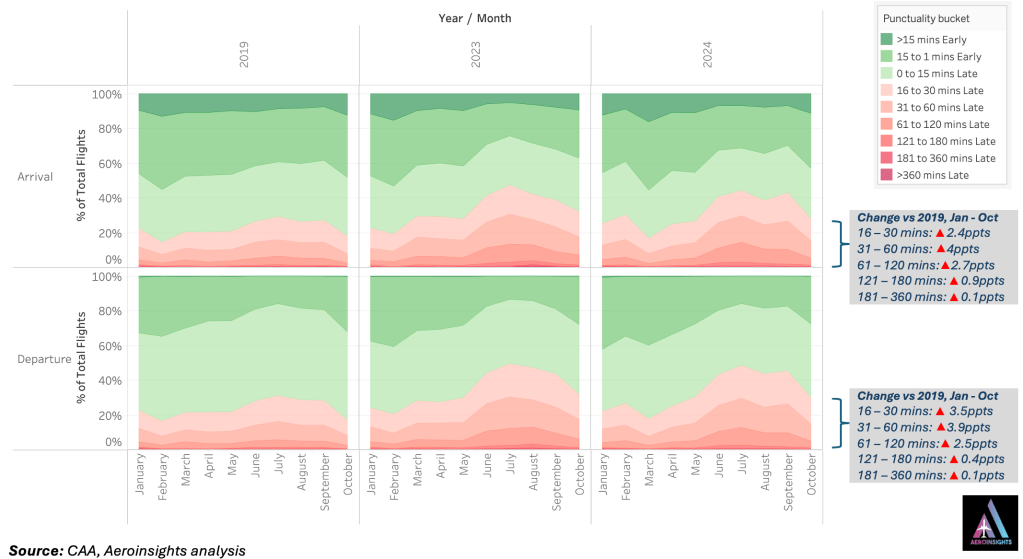
Analysis: again we can see the increase in delays more pronounced in summer months like at Gatwick with delays in the 31 – 60 min category up by 4ppts in both arrivals and departures.
Percentage difference in number of flights delayed
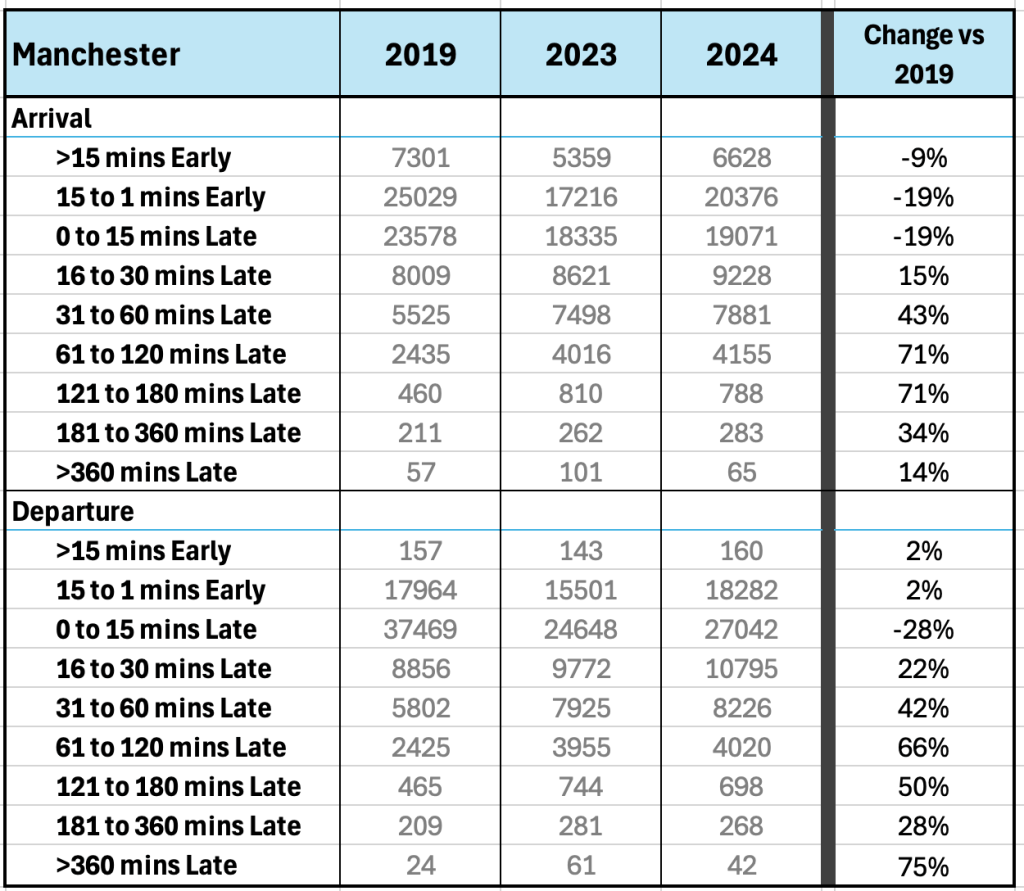
Similar to Gatwick, at Manchester, aircraft delayed on arrival in the 61 – 120 and 121 – 180 mins categories are 70% higher in 2024 than in 2019, but a slightly lower increase in departures implying that the delays are being recovered on the ground (turnaround, real-time optimisation, more buffer etc). A positive story for Manchester Airport on turnaround.
Key observations
- nOPT analysis shows categories of delays which continue to top-line OTP the most. These could be due to airport constraints, UK and Europe airspace congestion as demand gets back to 2019 levels, geopolitical airspace restrictions, aircraft/engine reliability etc.
- Summer months of June – September still show an increasing trend in the delays per category especially >30 mins, all other months have smaller
- Categories of delays over 60mins are still high compared to 2019 levels, most likely generating a significant UK/EC/EU 261 bill for airlines depending on the sector lenght and duration (more on this in a future post).
- Arrival punctuality is the key driver for poor departure punctuality from the trends above (late in, late out)
- Turnaround optimisation is heavily reliant on arrival punctuality, there is only so much optimisation that can be done to the turnaround. Optimisation needs to encompass the ecosystem (flight plan, airspace management, arrival and taxiing, stand management etc) and not just a few of them in isolation as it may be the case.
- There has been lots of investment by airports and airlines in AI / computer vision technology, if the primary cause of poor departure punctuality at the airport is poor arrival punctuality, how much improvement can airports/airlines realistically gain from turnaround optimisation especially when making a case for AI / computer vision technology tools?

Leave a comment