It is no secret that the pandemic had a disproportional impact on aviation and the industry is still on its recovery path to the operational performance and stability it once had pre-covid. The impact has been felt across airport in the UK with the busiest quarters (Q2 and Q3) still testing their resilience.
Operational performance for airline and airports is often measured by On-Time Performance (OTP) which indicates whether a flight departed or arrived within 15 minutes of its scheduled time.
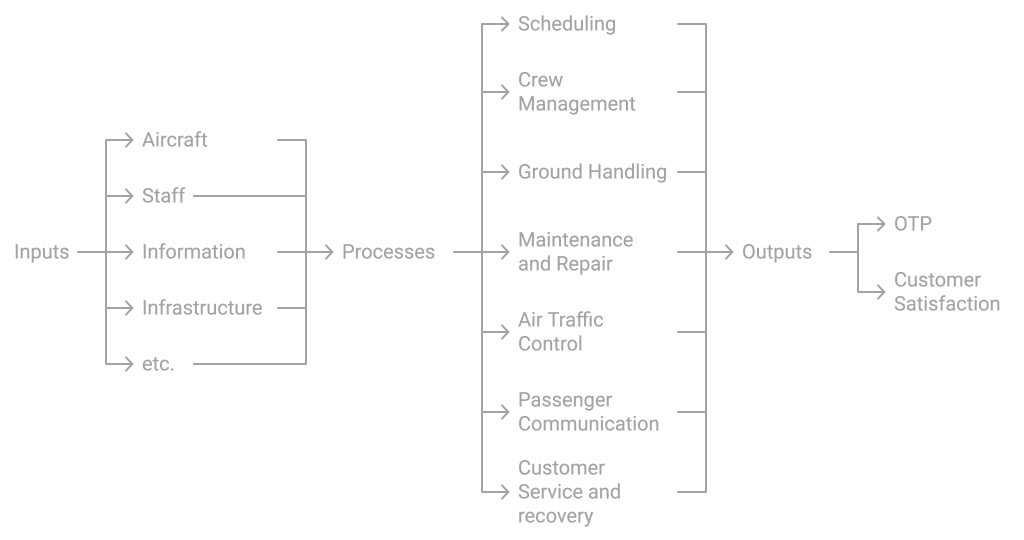
OTP is an output of complex inputs and processes which involve multiple stakeholders across the airport ecosystem and there are multiple publications on this out there.
The focus of this piece will be solely on the output (OTP).
There are several OTP reports and dashboards published by the likes of Cirium, OAG and UK CAA which show the gains/losses in OTP over time.
We will use the CAA’s published data to look at OTP with a different lens to see whether punctuality is indeed converging to pre-pandemic levels.
2020, 2021 and Q1 of 2022 are excluded from the analysis to provide a like-for-like comparison on number of flights operated before and after the pandemic. Charter flights are also excluded. At the time of this article, the latest data available was until July 2024.
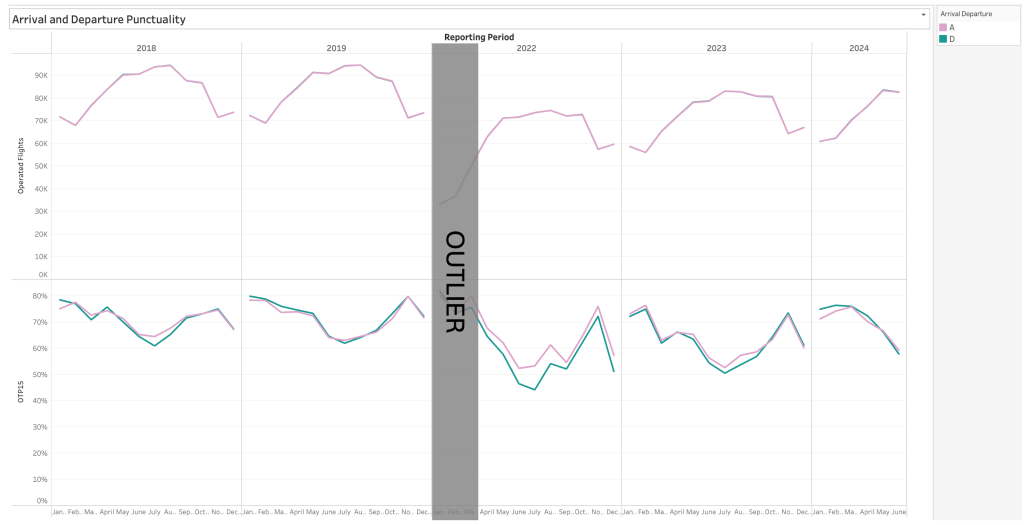
From the data, we can see that arrival punctuality took a hit post pandemic with around 10ppts drop which inturn impacted the departure punctuality. The other noticeable impact is the gap between arrival and departure punctuality which can infer turnaround performance. Ideally, they need to be close to each other, if departure OTP is below arrival OTP, it could mean loss in efficiency whilst the aircraft is on the ground (ground handling, engineering, ATC, weather etc).
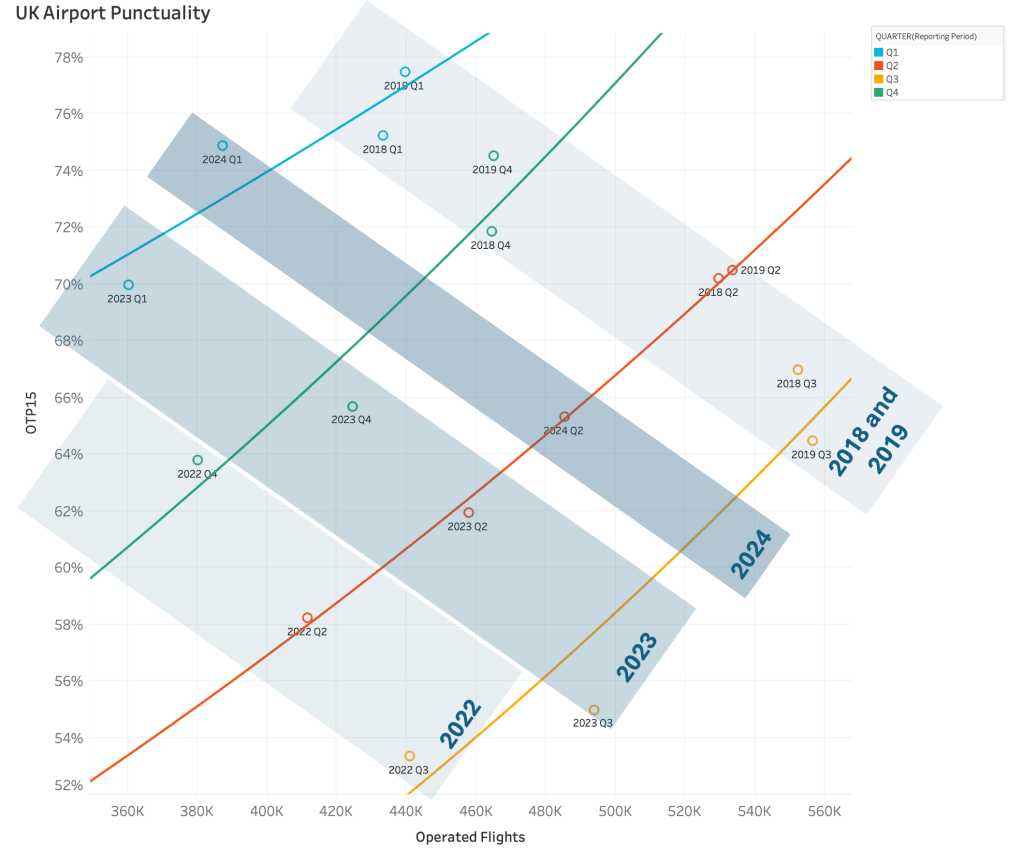
Arrival and Departure OTP vs Operated flights
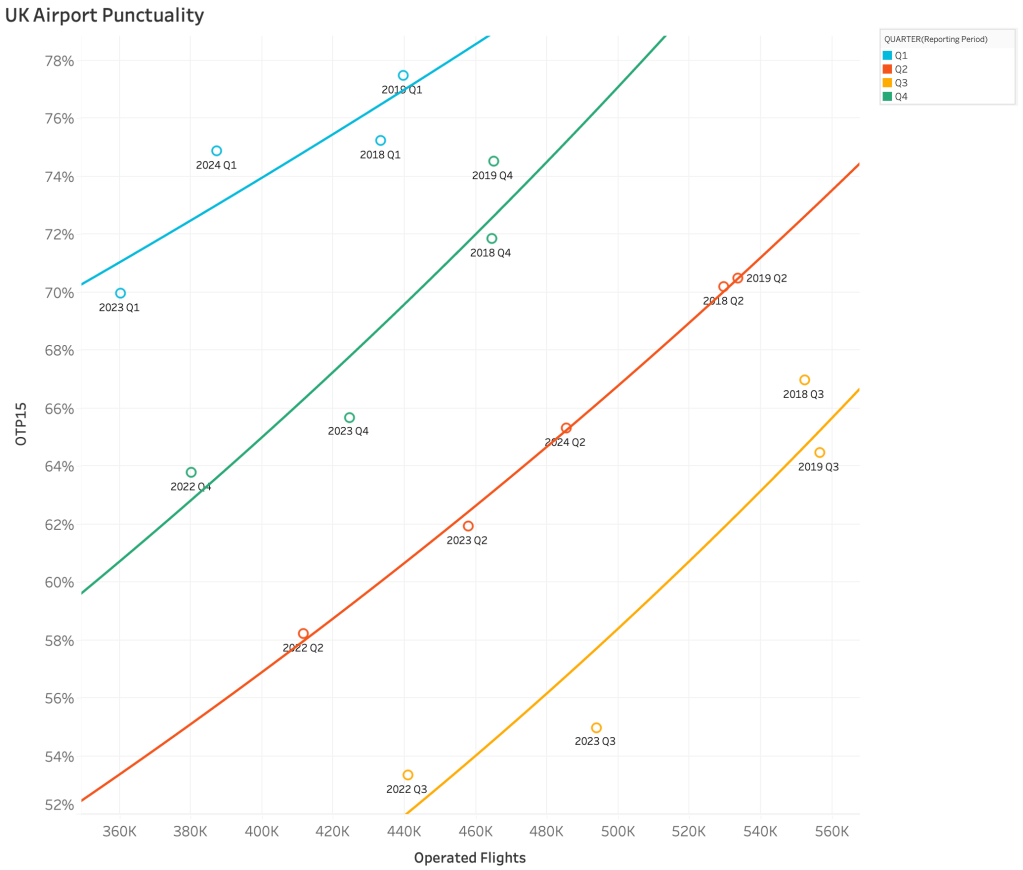
Looking at the overall punctuality vs operated flights for all UK airports, we can see that 2018 and 2019 sit in the upper and right quadrants. We can also see that each quarter the OTP post pandemic is now following a fairly predictable path to pre-pandemic levels.
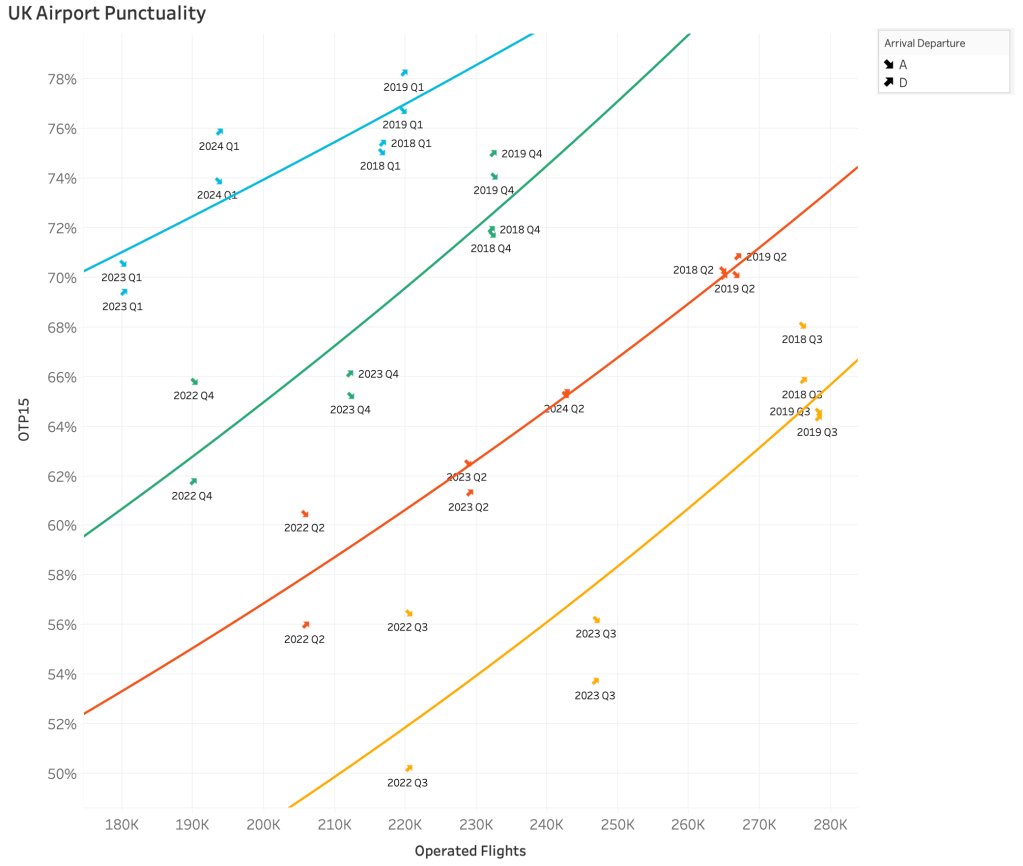
If we split out the OTP by arrival and departures, we can see the improvements in turnaround performance here again (the closeness of the A and D OTP markers) and the convergence towards 2018/2019.
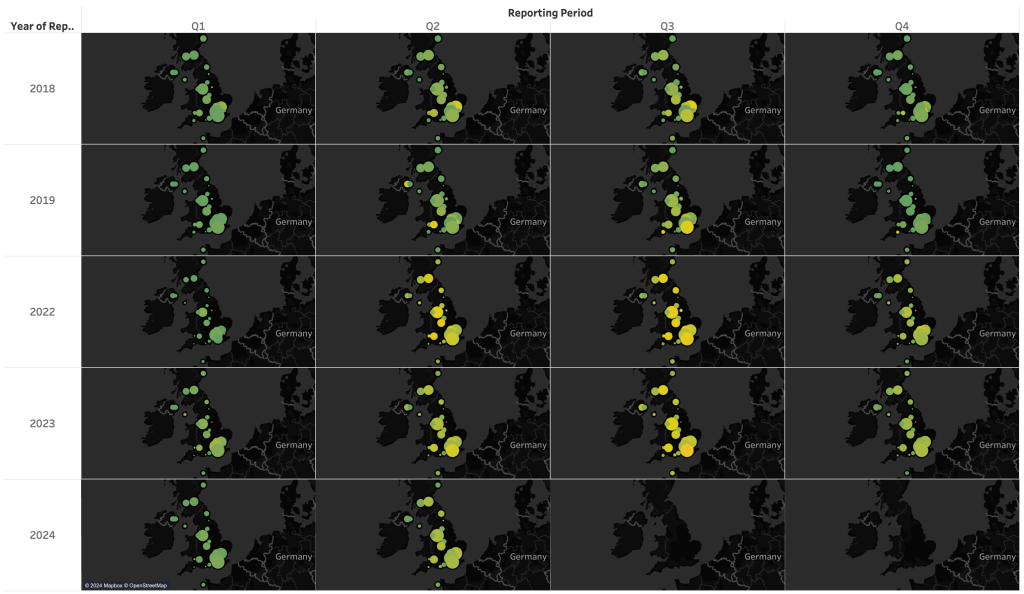
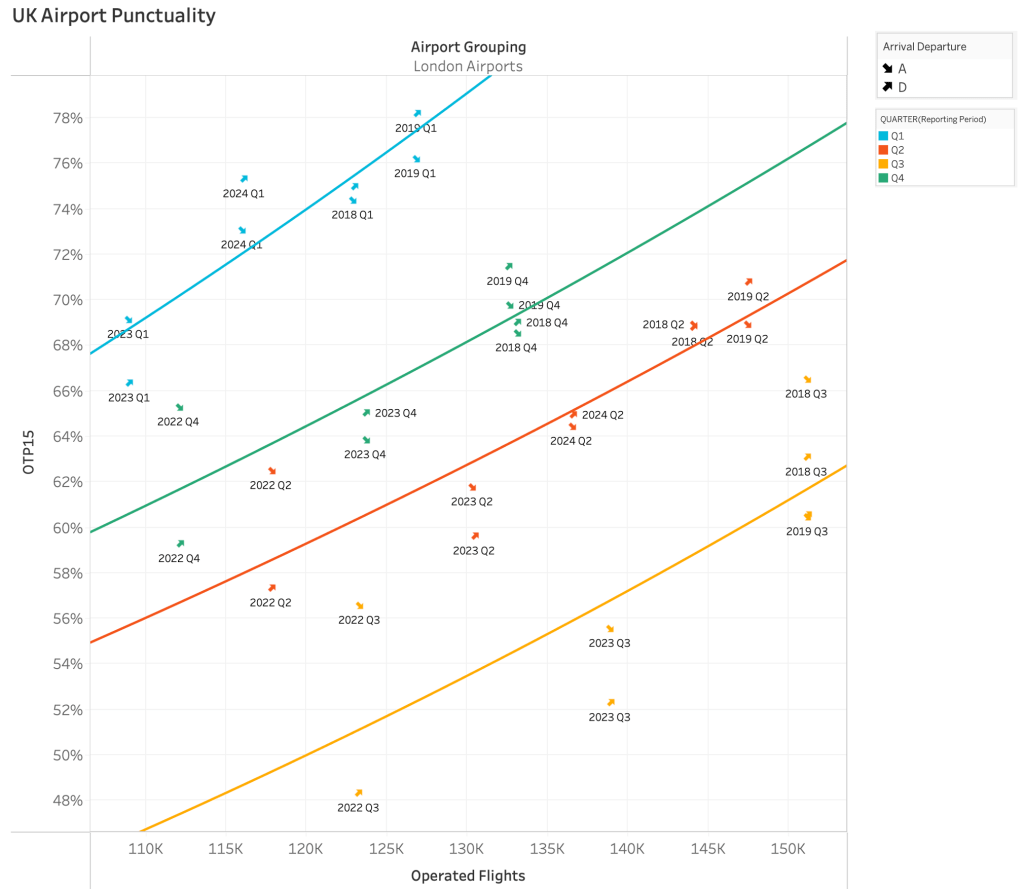
If we cluster the airports (London area is know to have the busiest airports), we can see this trend in 3 out of the 4 clusters we’ve looked at.
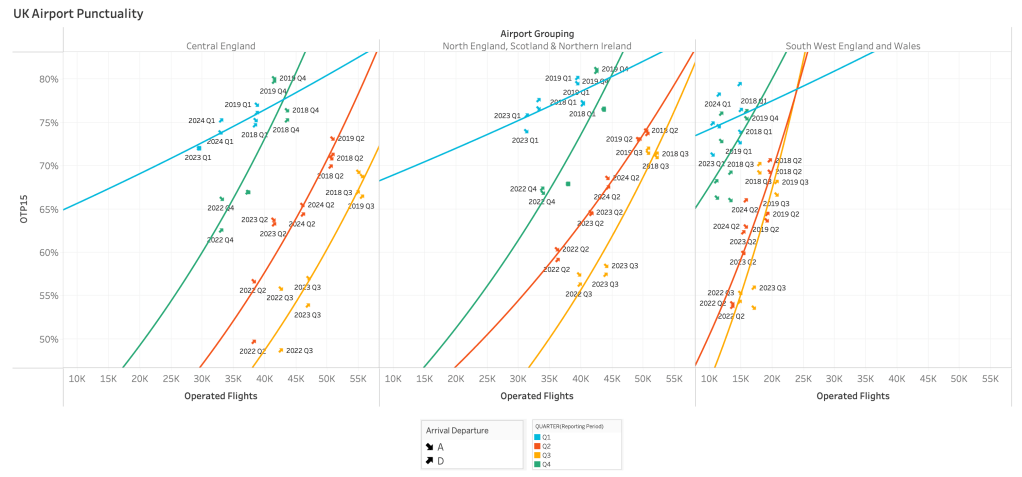
We can see the similar trend in the Central England and North England, Scotland & Northern Ireland airports cluster. With the lowest flight volume of the clusters, South West England and Wales has more scattered data points.
Cluster groupings
| London | Central England | North England, Scotland and Northern Ireland | Southwest England and Wales |
| Gatwick | Birmingham | Aberdeen | Bournemouth |
| Heathrow | Doncaster Sheffield (closed Nov 2022) | Belfast City (George Best) | Bristol |
| London City | East Midlands | Belfast International | Cardiff |
| Luton | Leeds Bradford | Edinburgh | Exeter |
| Southend | Liverpool | Glasgow | Jersey |
| Stansted | Manchester | Isle of Man | Southampton |
| Newcastle | |||
| Teeside International |
Key observations
- Turnaround performance appears to have improved across all the airports as of Q2 2024.
- Arrival performance is still affecting almost all airports and subsequently impacting departure punctuality
- Q1 2024 was a stellar month for all UK airports on arrival punctuality which propped up the departure punctuality (further demonstrating that turnaround related delays are minimal now compared to 2022/2023).
In the next article, we will take a ‘shallow dive’ into some of the key airport or airline performances.

Leave a comment